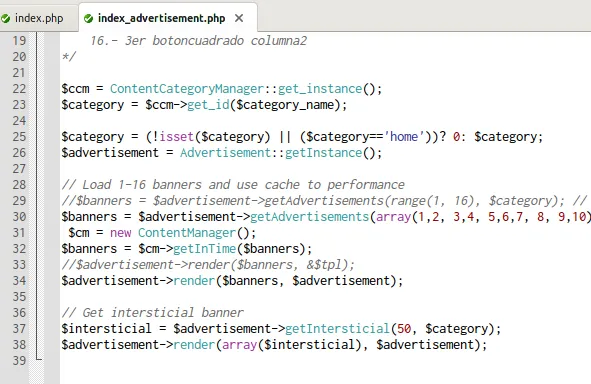
When you develop a very important web app it is pretty sure you will need debugging it. The best way to do this is using XDebug so in this article I am going to explain how to setup and use XDebug with Komodo IDE or Edit, but you can use it for Netbeans or Eclipse as well. The first step is install XDebug in your system (I assume that you have already installed a LAMP server in your system).
sudo aptitude install php5-xdebug
So now you should have the file xdebug.ini at /etc/php5/conf.d/. I have done some improvements on it so you can download my xdebug file and replace yours. Content of the file is categorized and ready to work out of the box but you have to change the line that loads the extension library to fit your path extension.
zend_extension=/usr/lib/php5/20090626/xdebug.soRestart your Apache server to reload the PHP configuration.
sudo service apache2 restart
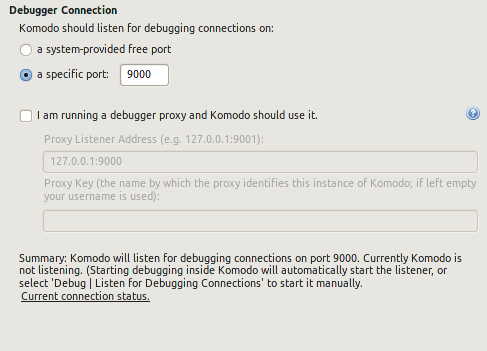
Now you have to set up Komodo Edit or Komodo IDE to listen XDebug connections. Start Komodo and go to Edit -> Preferences -> Debugger -> Connection and modify your configurations to fit the next screenshot.

So if you point your browser to your app, append the “XDEBUG_SESSION_START=1” HTTP GET parameter or use one Firefox (if you are using it) extension like Easy XDebug and Komodo will pop up pointing to the start point of your app. Now you can use keyboard shortcuts to step into, step over continue or stop your debugging session. I hope this could help you, and if you have any suggestion please contact me or write me a comment below.